This project demonstrates the capability of an urban design generation model developed by my research team for evaluating multiple scenarios for cooler cities focusing on Urban Heat Island (UHI) and Discomfort Index (DI) (Thom, 1956). We are using this model to assist city planners to identify design solutions that can achieve higher development densities without undue UHI impact.
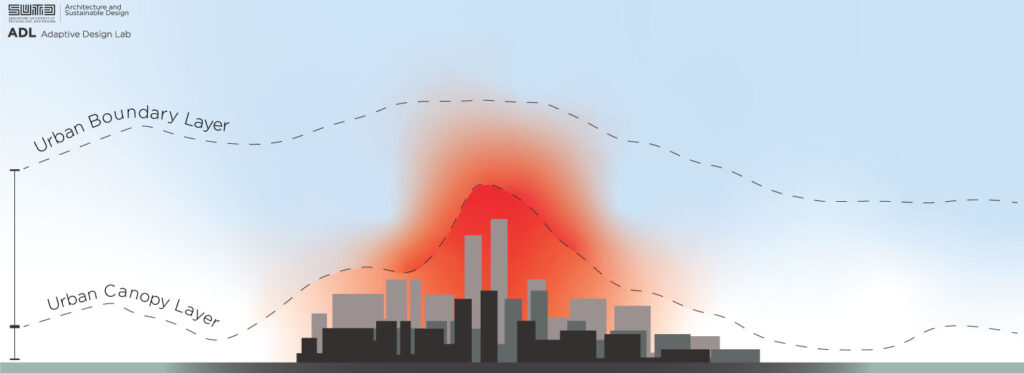
Urban Heat Island effect shown as a conceptual transect of urban-rural settlement indicating the limits of the urban canopy layer (roof level height of built environment) and the urban boundary layer (the atmospheric layer where urban temperature impact is no longer perceptible), redrawn after Oke 1976 and Murakami et al. 1999.
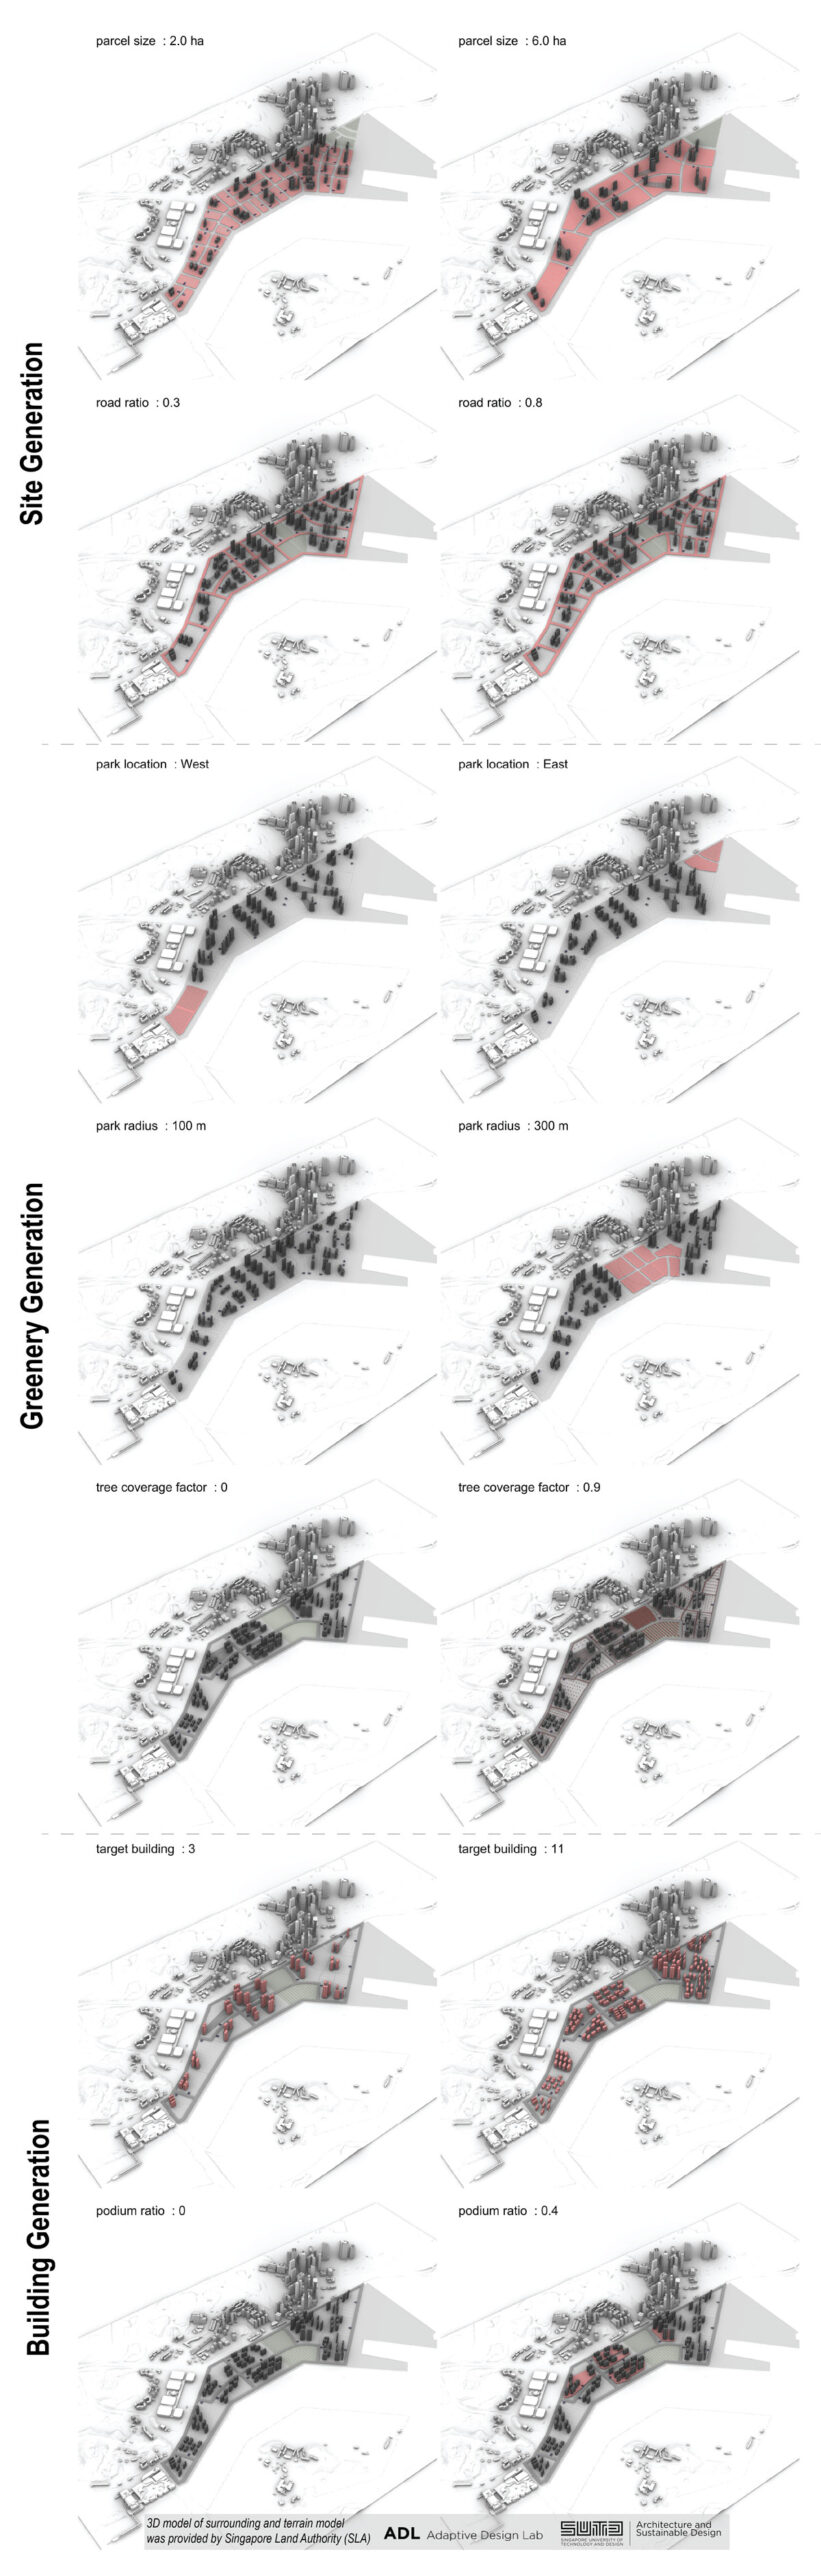
Visualization of design parameters’ minimum and maximum range values
Our generative urban model was designed with 9 variable parameters (parcel size, road density, green park location, green plot ratio, building density, podium density, podium height, tree coverage ratio, and roof construction type (i.e., conventional or green)), which meet URA development guidelines. For Greater Southern Waterfront as a study site, this research translates a generative design evaluation method to understand the impact of planning-level decisions on mitigating the adverse effects of environmental challenges.
This research explored the UHI performance of a wide variety of possible designs. Heat island and simplified discomfort analysis are simulated for each design iteration using the Urban Weather Generator (Bueno et al., 2013). A total of 9000 urban scenarios are assessed for green plot ratio, site coverage ratio, and gross floor area associated with road network layout, land parcel size, open green space size, and building density.
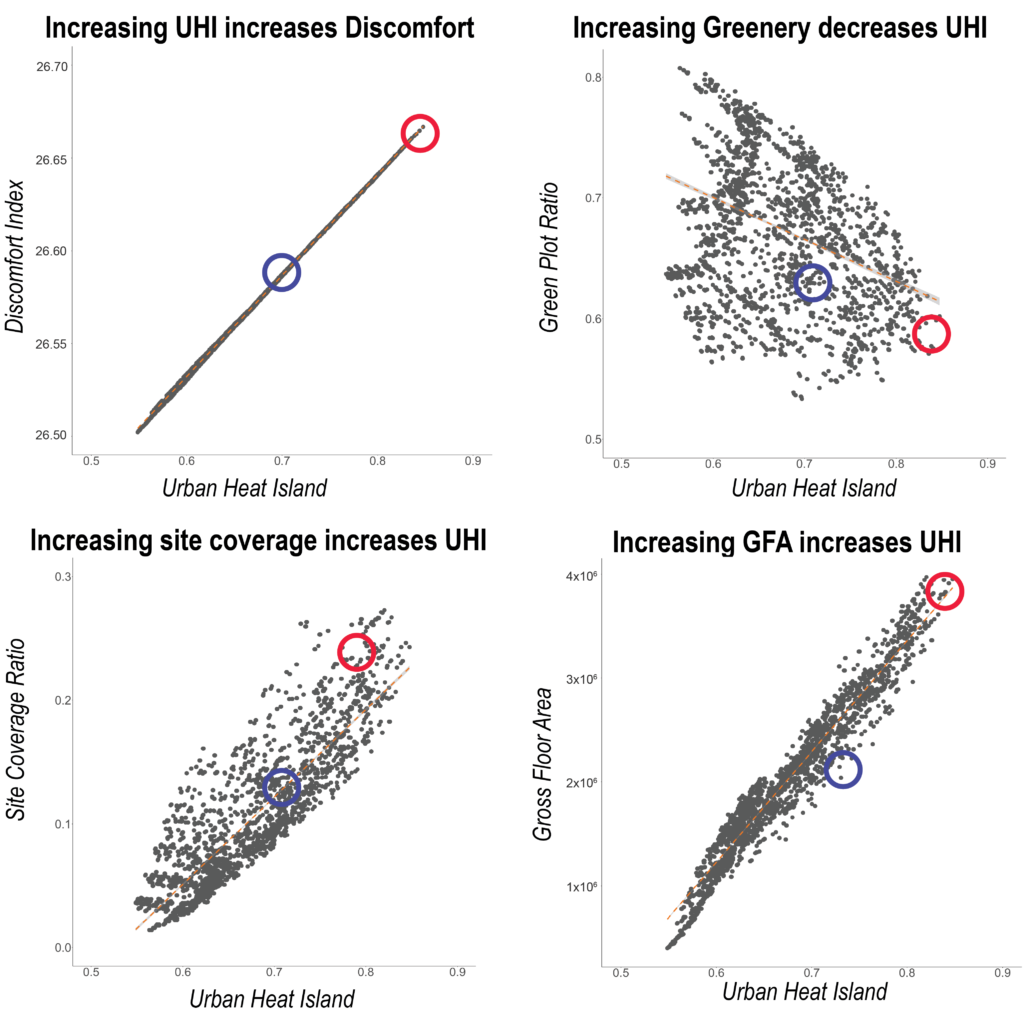
Scatterplot visualization of 9000 scenarios results
The research findings indicate that increasing greenery while reducing the site coverage ratio and gross floor area can aid in mitigating UHI. Considering the strong positive correlation between UHI and discomfort index (DI), applicable strategies applied to reduce UHI can also reduce outdoor discomfort for the population.
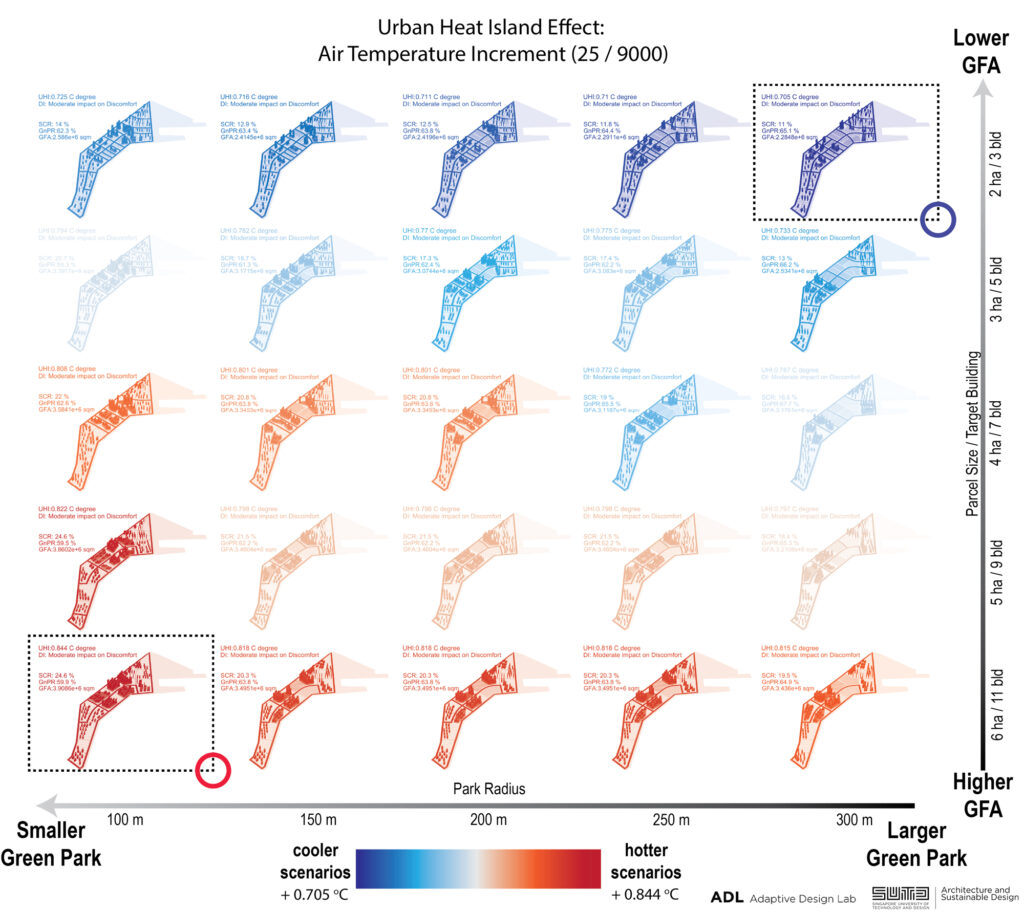
Data subset visualization for 25 scenarios out of 9000
A comparative subset of scenario illustration is a way of translating datasets for planners and designers. This comparative illustration shows the model’s and simulation’s functionality and provides insights into best practices for designing cooler spaces in the Greater Southern Waterfront.
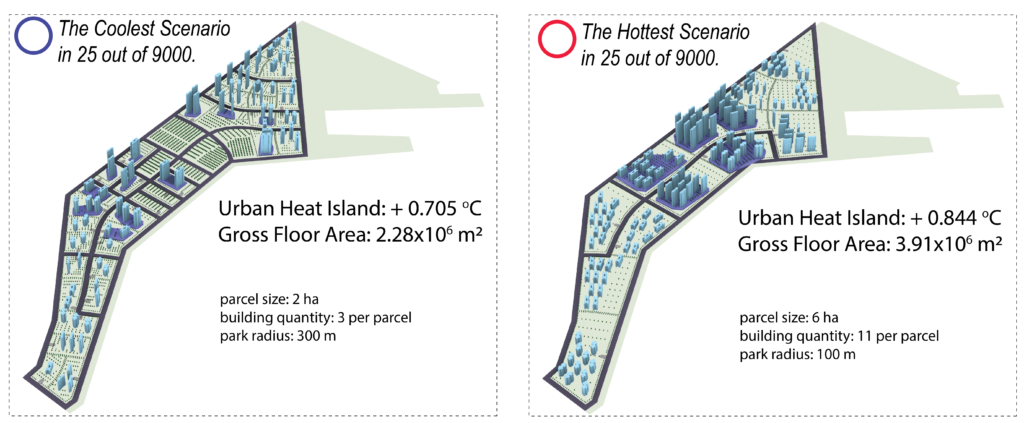
The coolest and hottest scenario comparison from a 25-scenario subset
With this generative model approach, we can vary design parameters and iterate through all generated scenarios to find the best, the optimal, and the worst results. This process enables planners to make better-informed decisions to create cooler neighborhoods.
Citations:
- Bueno, B., Norford, L., Hidalgo, J., & Pigeon, G. (2013). The urban weather generator. Journal of Building Performance Simulation, 6(4), 269-281.
- Murakami, S., Ooka, R., Mochida, A., Yoshida, S., & Kim, S. (1999). CFD analysis of wind climate from human scale to urban scale. Journal of Wind Engineering and Industrial Aerodynamics, 81(1-3), 57–81. https://doi.org/10.1016/S0167-6105(99)00009-4
- Oke, T. R. (1976). The distinction between canopy and boundary-layer urban heat Islands. Atmosphere, 14(4), 268–277. https://doi.org/10.1080/00046973.1976. 9648422;
- Thom, E. C. (1959) The Discomfort Index, Weatherwise, 12:2, 57-61, DOI: 10.1080/00431672.1959.9926960
Credits:
PI: F Peter Ortner
Research Fellow: Elif Esra Aydin
PhD Candidate: Tay Jing Zhi
Research Assistant: Zebin Chen, Anna Yenardi
Funding: URA Strategic Partnership Grant
Acknowledgement: Singapore Land Authority for providing 3D surrounding and terrain model.